How to use Volatility Trading Strategies to diversify your portfolio!

1.) What is Volatility Trading?


Before we dive into the really intersting topics let's start with a basic question to get everyone on the same page:

What is Volatility? 


"Volatility is a measure of price-changes in a defined amount of time
and can be measured for any asset that is undergoing price fluctuations."


And there are different trading strategies that can profit from increasing, decreasing or even steady volatility values. 

On this site we are concentrating mainly on the Volatility of the Stock market index S&P 500 that tracks the performance of the 500 largest U.S. public companies. And there is even an own index called VIX that is calculating the constant 30-day expected volatility of the S&P 500 index. You can look up it's current value on nearly any stock market or trading platform by searching for "VIX".

And there is a small universe of different products around this VIX index that is available for trading. And when we are talking about "trading volatility" on this site we are mainly focusing on products of this "VIX" family. So no strategies on the volatility of single stocks but only on the "volatility of the S&P 500" index.

So with this in mind let's continue with the question every Investor and Trader is most interested in:

2.) Can you make money on “trading volatility”?


Sure you can make money with "trading volatility". But you should also know that people "trading volatility" are probably more advanced then the "regular person" that is trading single stocks. So you should not expect that "trading volatility" is easier than any other asset class. Above all please don't expect that there is some kind of "free lunch" here just because you saw a chart that seems to go just straight in one direction.

But the beauty is that "volatility products" are an own asset class and can be a usefull tool to diversify your portfolio if you know what you are doing. An allocation of 10-20% of your overall portfolio could be a reasonable target size.

If you look at the charts of a Volatility ETP (like VXX or UVXY) it's easy to guess that the "short" side of the Volatility-ETP is more likely to succeed since it's value is decreasing over time. (why that happens, we will learn later on this page).

On the other hand it's tempting to use those Volatility products as an "insurance product" for a stock market portfolio to have some inverse correlation and to profit in case the stock market is crashing. But since "insurance" always has a "price" you shouldn't hold it too long otherwise you will loose because of the natural decay of the product. 

You will see that effect also in the trading examples that i provide later on this side: The short trade is much more profitable compared to the long trade. Of course you can use both "sides" of the trade (like shown in the trading example later on this page).

But you should also know that sudden volatility spikes or crushes can happen out of nowhere - and you should always have some kind of risk management in place so that you don't get into a uncomfortable drawdown (or even blow up your account).

If you look at the high GAINS (that are often presented by Volatility Trading Services out there) you should always remember that LOSSES are pretty costly. If you loose 50% of your account - you need to gain not 50% to break even BUT 100%.

With that in mind let's briefly look at the following *important* date:

3.) The 5th Feb 2018: Why you should know this date!


The 5th Feb 2018 is an important date for the Volatility Trading space and there are several lessons learned for investors. This date is also often called as "Volmageddon" or "Volpocalypse".

To summarize what happened on that date here is the short version:

The VIX index gained over 110% on that day and due to this volatility spike very popular inverse volatility ETPs like Credit Suisse’s XIV or ProShares SVXY lost over >90% of it's value. But the majority of the loss happend not because of this volatility spike but because of the aftermarket rebalancing phase due to a liquidity issue in the VIX futures. Investor assets in the Billions where lost and XIV was even terminated after this event.

Here are some lessons learned:

1.) Understand the products that you trade. 

Some people recognized the large amount of VIX Futures those Volatility ETP where moving at this time and where aware that liquidity could be a problem somewhere down the road. Understanding how the instruments work that you trade is as important as your trading strategy.

2.) Diversify in multiple assets and different strategies and be your own risk manager.

Never take risks that could damage your portfolio in a single day event so harsh that it could take you years to recover. Black Swam Events happen eventually and you should be prepared and well diversified to get never hit too much.

3.) Carefully choose and check your "investment service providers"

Before that date there where plenty of "Volatility trading services" that promised to make a lot of "easy" money through "shorting volatility". Some of those websites are still online even if they are out of service since then. If you choose a "investment service" here are some basic questions:

  • How long are they in service? (Check their website through the Wayback Machine)
  • Be careful if they talk more about GAINS than about RISK management!
  • If you sign up look for historical data of their service and look especially how they performed on critical market events. Be especially carefull if their data starts short after one of the last crashes. (You can assume they had very poor results in the last crash and have something to hide.)
  • Always diversify your portfolio with different strategies that are not directly correlated.

4.) What is the VIX index and can you trade it?


The VIX index is probably the most watched volatility indicator in the financial market. It was introduced by the CBOE (Chicago Board Options Exchange) in 1993 and it was based on the S&P100 back then.

Since 2003 it's been based on the S&P 500 and it estimates the expected 30-day volatility of the stock market by analyzing a wide range of S&P 500 (SPX) index options. If you are interested in more details about the VIX index you can find a lot of information directly on the CBOE website.

So let’s look at the chart of the VIX index from 2004 until 2022:

VIX index chart


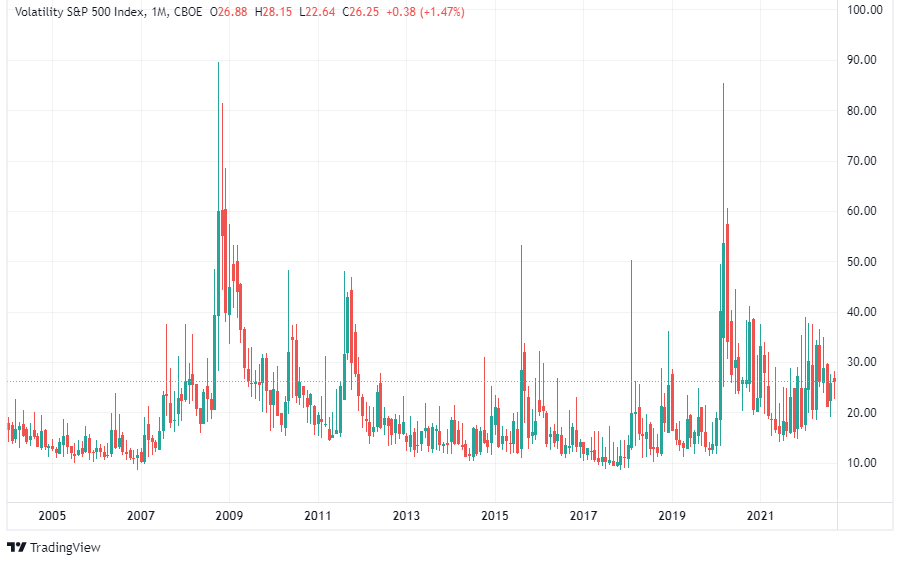
If you look at the VIX spikes in this chart you can easily detect some of the stock market crashes of the last 18 years: 

  • 24 Oct 2008 with a VIX of 89.53 (SPX drawdown of -45%)
  • 24 Aug 2015 with a VIX of 53.29 (SPX drawdown of -12.5%)
  • 06 Feb 2018 with a VIX of 50.30 (SPX drawdown of -9.8%)
  • 18 Mar 2020 with a VIX of 85.47 (SPX drawdown of -32.8%)


While i am writing this in Sept 2022 we had in this year already a SPX drawdown of -24% but the VIX stayed always below 40 which is quite interesting: Compared to previous stock market crashes the option market participants (where the VIX index get it's values from) seems to not priced in the risks of this crisis.

And that brief digression already shows that the VIX index on it's own should not be used as a standalone "market indicator" to trade the stock market. 


Can you trade the VIX index?


The VIX index itself (Ticker-symbol "VIX") can not be traded. But you can trade: 

  • VIX Options
  • VIX Futures
  • Volatility ETF (that hold different allocations of VIX Futures)

Both the VIX Options and Futures are available with different expiration cycles. And both are cash-settled since there is no possibility of physical delivery. 

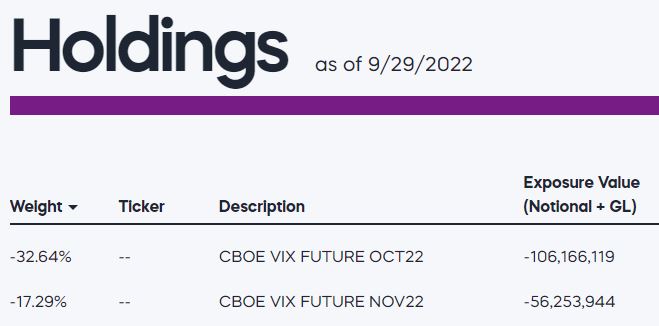
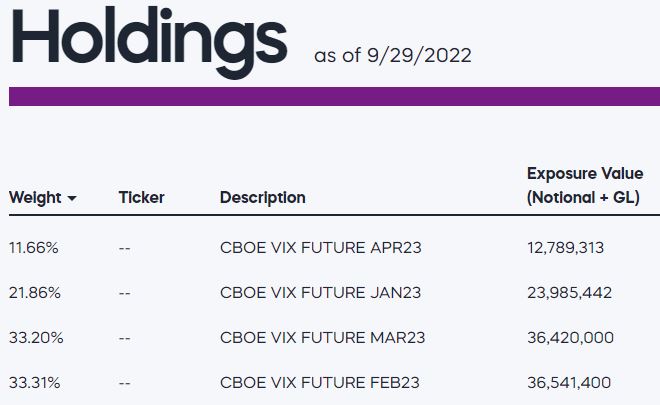
If we look at the Volatility ETFs solutions they can differentiate between:

  • "short term" vs. "mid-term" VIX Futures
  • "short" vs. "long" versions
  • different leverages (0.5x / 1x / 1.5x / 2x)

In the next section you can find a list of different Volatility ETF.

5.) A List of Volatility ETF and ETN


The following ETF and ETN are available for trading:

Symbol Name Structure Exposure Avg. Maturity
UVXY ProShares Ultra VIX Short-Term Futures
ETF +1.5 30 days
VXX  iPath Series B S&P 500 VIX Short-Term Futures
ETN +1.0 30 days
VIXY
ProShares VIX Short-Term Futures
ETF +1.0 30 days
SVXY
ProShares Short VIX Short-Term Futures
ETF -0.5 30 days
VIXM ProShares VIX Mid-Term Futures
ETF +1.0 5 months
UVIX
2x Long VIX Futures
ETF +2.0 30 days
VXZ
iPath Series B S&P 500® VIX Mid-Term Futures
ETN +1.0 5 months
SVIX
-1x Short VIX Futures
ETF -1.0 30 days

What are the differences between an ETF and ETN?


Here are the definitions:

  • ETF = Exchange-Traded Fund
  • ETN = Exchange-Traded Note

Even if it sounds similar (and maybe even some readers didn't realize that some products had an "ETF" and others an "ETN" in the description): There is a big difference between the structure of an ETF compared to an ETN: The ETF's are an asset - the ETN's a liability.

If you hold an ETF you "own" the underlying investment: In case of a Volatility ETF it's often different allocations of VIX Futures.

If you buy an ETN you own a debt instrument from a investment entity. The price of an ETN will not only be influenced by the underlying index BUT also by the credit worthiness of the issuing institution.

6.) Why Quant based Volatility Trading Strategies? 


I prefer to trade quant based strategies because it takes out your personal emotions. Of course trusting those "quant based" trade signals can be again a "emotional" rollercoast but i think it is much better then just trading on your gut feeling. 

You should always backtest strategies and see how they would have performed in different market environments. And you should be aware that there is always the risk of overfitting your strategies because you are testing with historical "fixed" data. 

Therefore it can be helpfull to start with a "basic trade idea" that makes "logical sense". Then test different parameters and see how they influence your results. Finetuning results on performance does not make much sense because it's always based on historical values that will probably not perform the same way in future. I think a good approach is to have a strong focus on drawdowns: Because at some point every trader will loose confidence in their own strategies if a certain drawdown occurs in "real money" mode.

Also keeping an eye on the trade frequency can be an important factor.

With those words in mind let's have a look at some simple Volatility trading strategies.

7.) A Volatility Trading System with a simple algorithm:


Important note: These trading examples are simple strategies and should not be interpreted as personal investment advice. 


Example 1: A SHORT Volatility Trading Strategy!

Our simple trading idea for this "short volatility trading strategy" is to only trade a Short Volatility ETF in calm market phase. As soon there are "troubles" on the horizon, we will exit those position and hold cash.

We will not directly short (sell) a Volatility ETF because with a short trade your risk of loss is theoretically unlimited and you can loose much more then your initial investment amount.

In this simple short trading strategy we will use the ProShares Short VIX Short-Term Futures ETF SVXY which is only trading with a factor of -0.5. More information about this fund you can get on the product page. There you can find always the actual allocations of this fund.

For example on the 9/29/2022 this fund is short 2 different VIX Futures:

SVXY Holdings VIX Futures

You can see that the SVXY is short -33% of the "OCT22 VIX Future contract" and -17% of the "NOV22 contract" so that it holds an average of "30 day to expiration" VIX futures. And it is only allocated -50% of the fund capital.

In our simple Short Volatility Trading Strategy example we are open and closing the SVXY positions always end of day. As Trading Parameter we are using: 

  • VIX index: 30 day forward implied volatility 
  • VIX3M index: 3 month forward implied volatility


Then we calculate the ratio of both values: VIX : VIX3M. In a Chart it looks like this:


So for example a value below 1 means that the "30 day implied volatility value" (VIX) is trading below the "3-month value" (VIX3M) which implies a rather calm market environement. As mentioned before we only want to trade the SVXY when the market is more calm. 

We want to achieve this by comparing the end of day VIX : VIX3M value to all historical values and calculate the percentile rank. This normalized "signal" looks the following way in a chart:


This "end of day" percentile value is now our trading signal. Every time the percentile rank is below <50% of all previous values we will be holding the SVXY ETF and as soon it moves above this 50% threshold we will exit the SVXY position. 

The results are shown in the following chart. Red line is the Trading Return and the yellow line is the Drawdown. 

Short Volatility Trading Strategy

This strategy has a total return of 1.740% or 32.7% per year with around 26 trades p.a. And it holds the SVXY on around 50% of trading days. But the thing i don't like is the drawdown of -38% which is pretty high for my risk tolerance. 

Important note: I wouldn't trade this "simple" strategy in my own trading account because of the high drawdown. But maybe it inspires you to develop your own trading strategies.


Example 2: A LONG Volatility Trading Strategy!

Our simple trading idea for this "long volatility trading strategy" is to only trade a Volatility ETF in the highest range of market uncertainty.

As underlying for this strategy we will use the ProShares VIX Mid-Term Futures VIXM ETF. This index maintains a weighted average of 5 months to expiration VIX future contracts and moves therefore slower then the "30 day to expiration" products like VXX or UVXY. On the product  page you can see always the different holdings of this ETF.

On the 9/29/2022 for example the VIXM did hold 4 different VIX Futures in the following allocation sizes:

VIXM ETF VIX Future Holdings

As you can see in the picture the ETF holds VIX Futures from around 4 to 7 months until expiration and to keep the "weighted average of 5 months to expiration" they need to reduce the (nearest) JAN23 contract (21%) and increase the (farest) APR23 contract (11%) on a daily basis while the two "middle" FEB23 and MAR23 contracts are equal weigthed (33%) - of course until they also completly disappear in the ETF. 

In our simple Trading Strategy example we are open and closing the VIXM positions only end of day. As Trading Parameter we are using again:

  • VIX index: 30 day forward implied volatility 
  • VIX3M index: 3 month forward implied volatility


Like in the first example we calculate the ratio of both values: VIX : VIX3M. So for example a value above 1 means that the "30 day implied volatility value" (VIX) is trading above the "3-month value" (VIX3M) which implies rather market uncertainty. As mentioned before we only want to trade the VIXM in the highest range of market uncertainty.

We want to achieve this by comparing those end of day values to all historical values and calculate the percentile rank. This "end of day" percentile value is now our trading signal. 

And now every time the percentile rank is crossing a >75% threshold we are entering the VIXM positions and as soon it moves below this 75% value on the next trading day we exit the VIXM position. This chart shows the percentile rank values with the 75% treshold:


The trading results are shown in the following chart. Red line is the Trading Return and the yellow line is the Drawdown. The blue line is the "horrible performance" of a "buy and hold" VIXM position.


As you can see in the chart this does not seem promising with high drawdowns and ZERO return. 

But what happens when we trade this strategy in much higher elevated conditions. So let's adjust the threshold to 95%: 


As you can see this strategy is now triggered less often. And here you can see the resulting chart:

VIXM Trading Strategy

The total return of this "strategy" is around 115% which is achieved in only 5% of trading days and has a max Drawdown of -17%. As you can see in the chart this strategy mainly did profit from the March 2020 crisis. 

And it shows also that the long side of this trade is much more challenging. But it seems to help if you only enter trades when volatility is already pretty elevated.

Important note: I personally wouldn't trade this "simple" strategy but hopefully it inspires you to start to test your own "quant based" strategies.


Example 3: Combine a SHORT and LONG Strategy!

Since we used for the two previous examples the same trading parameters in different ranges we could combine both strategies with the same allocated capital.

So we could trade the short strategy below the 50% threshold and above the 95% range we would enter the long strategy. In the range between 50%-95% we would just hold cash. (or use the capital for other strategies that possibly could perform well in elevated volatility environment)


If we combine both strategies it would result in the following chart:


Pretty impressive result with 3.860% return in 10 years. I would gladly take a 38x of my money in 10 years. But we shouldn't forget to look at the yellow drawdown chart.

If you would have started to trade this strategy starting from 01.01.2018 you would experience a 2 year drawdown up to -35% percent. Would you stick to this strategy or would you've already quit the strategy before the  "performance boost" from the Corona crisis came? 

And secondly such a volatility strategy should only be traded with a smaller allocation size so the "tempting" total return would only be on a smaller allocation size of your portfolio. And please never overallocate strategies with "tempting returns" because you never know which Black swam event could happen while holding volatility products.

Important note: I don't trade this combined strategy. But it shows you that combining and rotating between different strategies can boost your performance by a lot.

8.) When to use Options to trade Volatility?

When to use Options to trade Volatility?

9.) Should you use leveraged products to boost performance?

Should you use leveraged products to boost performance?

10.) Which “Volatility Trading System” do i follow?

Which “Volatility Trading System” do i follow?

11.) Who is Brent Osachoff from “Volatility Trading Strategies”?

Who is Brent Osachoff from “Volatility Trading Strategies”?

12.) Last words: Are ALWAYS the most important!

Last words: Are ALWAYS the most important!